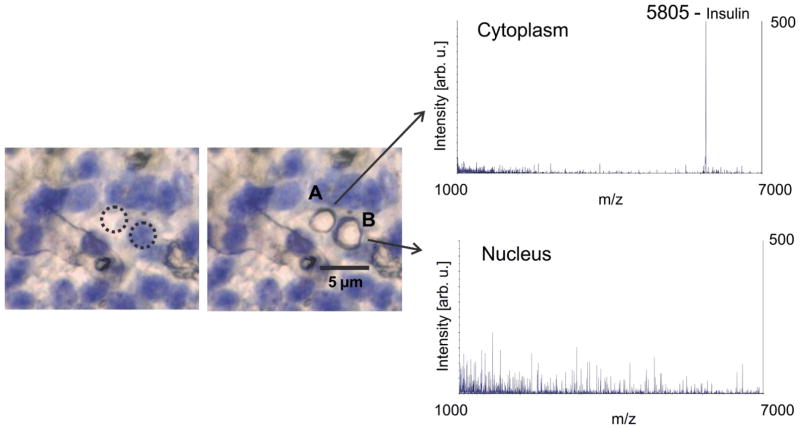
Figure 6.
IMS profiling of proteins with sub-cellular resolution of human pancreas islet cells. Left – pancreatic tissue islet cells with nuclear stain. Right – stained image of the same tissue area following laser ablation with the mass spectrum shown for each spot. The spectrum from the cytoplasm shows signal for insulin, as expected

