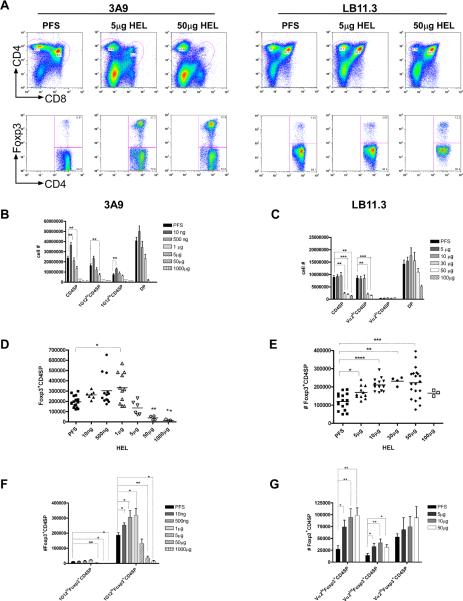
Figure 2. Negative selection and Foxp3 expression in LB11.3 and 3A9 mice injected with HEL.
(A) top. Representative CD4 and CD8 flow cytometry profiles of thymocytes from 3A9 and LB11.3 TCR transgenic mice injected with saline (PFS), 5, or 50 μg of HEL. Bottom shows corresponding Foxp3 expression gated on CD4SP. (B) Total number of thymocytes within CD4SP/DP from 3A9 mice injected with the indicated amounts of HEL. IG12 indicates thymocytes positive for a monoclonal antibody to the TCR of 3A9. Bars correspond to pooled data from 15 mice (PFS), 7 mice (10ng), 13 mice (500 ng), 11 mice (1μg), 6 mice (5μg), 4 mice (50μg) and 3 mice (1000μg). (C) Total number of thymocytes within CD4SP/DP sub-population from LB11.3 mice injected with titrated amounts of HEL. Bars represent pooled data from 17 mice (PFS), 13 mice (5μg), 15 mice (10μg), 4 mice (30μg), 20 mice (50μg) and 4 mice (100 μg) (D) Total number of Foxp3+CD4SP thymocytes in 3A9 mice shown in (B). (*) indicates p=0.0148. (E) Total number of Foxp3+CD4SP thymocytes in LB11.3 mice shown in (C). Each symbol represents an individual mouse. (F) Foxp3 expression within 1G12hi and 1G12lo CD4SP in 3A9 mice shown in figure D. (G) Foxp3 expression within different Vα2 expressing CD4SP subset in LB11.3 mice shown in figure E. Unless exact p values are provided, for all figures, (****) indicates p<0.0001, (***) indicates p<0.001, (**) indicates p<0.01 and (*) indicates p<0.05. All graphs are based on flow cytometry data gating on CD4SP cells.

