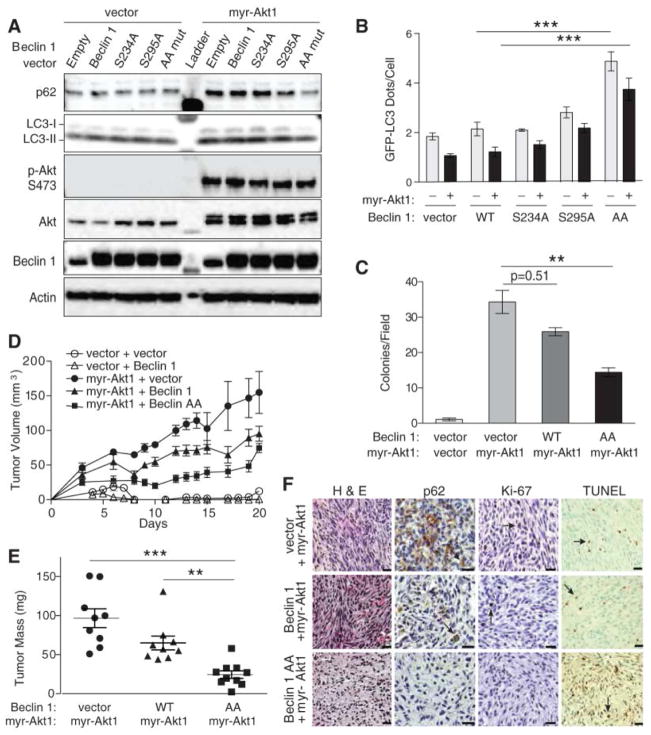
Fig. 2.
Effect of a non-phosphorylatable mutant of Beclin 1 (Beclin 1 S234A/S295A (AA)) on autophagy, anchorage-independent growth, and Akt-mediated tumorigenesis. (A) Biochemical assessment of autophagy in Rat2 fibroblasts expressing indicated Flag-Beclin 1 and Akt constructs. (B) GFP-LC3 dots in Rat2 cells transduced with indicated lentiviral vectors and transfected with GFP-LC3. Bars represent mean ± SEM of triplicate samples with >50 cells analyzed per sample. Similar results observed in 3 independent experiments. (C) Soft agar colonies formed by Rat2 fibroblasts transduced with indicated vectors. Bars represent mean ± SEM of triplicate samples of ≥12 random images analyzed by ImageJ. Similar results observed in 3 independent experiments. (D) Xenograft tumor volumes formed by Rat2 fibroblasts transduced with indicated vectors. (P<0.001 for myr-Akt1 + Beclin 1 AA group vs. myr-Akt1 + vector or myr-Akt1 + Beclin 1 groups; linear-mixed effect model). (E) Tumor weights at day 21. (F) Representative images of tumors formed by Rat2 fibroblasts. Arrows denote representative p62-, Ki-67-, and TUNEL-positive cells. Scale bars, 20 μm. For (D) and (E), results represent mean ± SEM for all tumors in each genotype (9–10 per group). *P<0.05, **P<0.01, ***P<0.001; Tukey-test.

