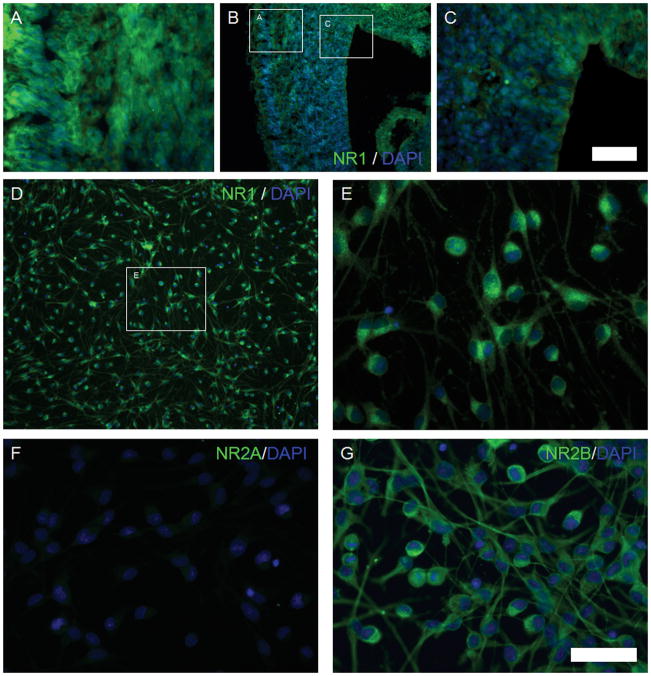
Figure 2. The expression of NMDA receptors in cultured NSPCs from rat fetal cortex.
Images A–C: the expression of NR1 in the rat fetal brain, NR1 (green) and DAPI (blue). Image A: cortical plate (400X magnification); Image B: entire neocortex (100X magnification); Image C: VZ and SVZ regions (400X magnification). Images D and E: the expression of NR1 (green) in cultured NSPCs; Image E is a magnified picture of the inset of Image D. Images F and G: the expression of NR2A and NR2B in cultured NSPCs. Image F: NR2A (green) and DAPI (blue); Image G: NR2B (green) and DAPI (blue). (Scale bars: 50 μm)

