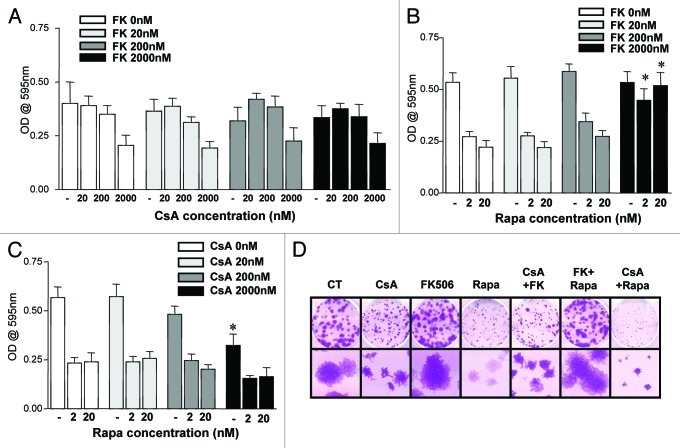
Figure 3. Effect of the combination of drugs in the growth of CACO-2 cells. (A, B and C) CACO-2 cells were cultured for 72 h in the presence of indicated inhibitors at concentrations depicted in each panel. Drugs were combined as noted. Samples were stained with violet crystal to quantify cell growth. Results are the mean of two to three independent experiments. (B) * marks p < 0.05 when comparing the group treated with the same Rapa concentration in the absence of FK506. (C) * marks p < 0.05 when comparing the group treated with the same Rapa concentration in the absence of CsA. (D) Clonogenic assay of CACO-2 cells cultured in the presence of CsA (2 μM), FK506 (2 μM) or Rapa (20 nM) alone or in combination, as depicted in the figure. Results are representative of two independent experiments.

An official website of the United States government
Here's how you know
Official websites use .gov
A
.gov website belongs to an official
government organization in the United States.
Secure .gov websites use HTTPS
A lock (
) or https:// means you've safely
connected to the .gov website. Share sensitive
information only on official, secure websites.
