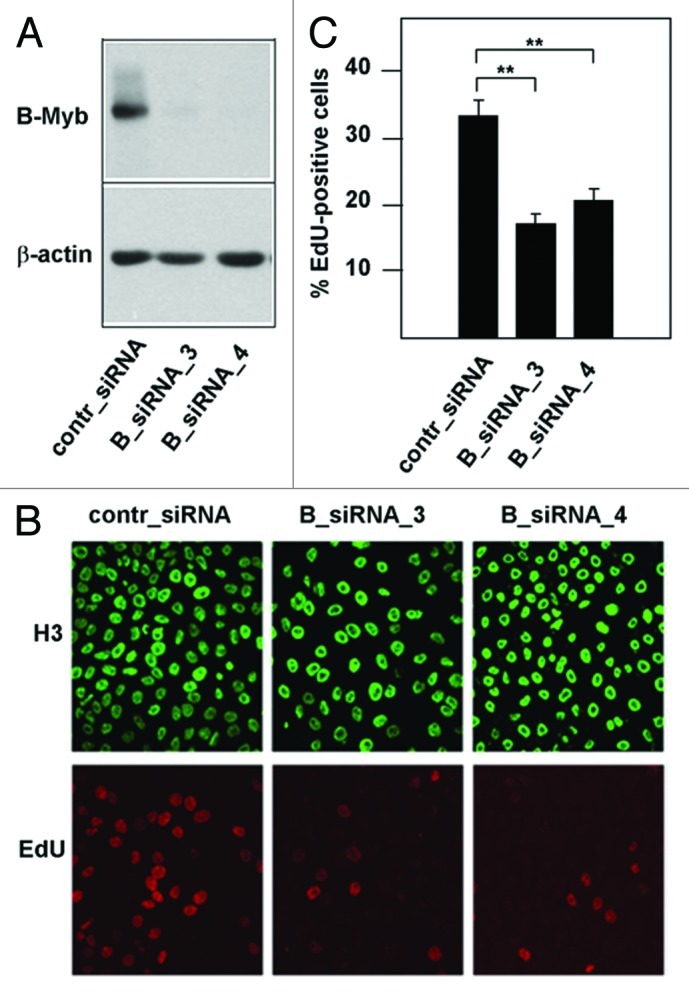
Figure 1. Knockdown of B-Myb reduces the fraction of S-phase cells. (A) HepG2 cells transfected with control siRNA or with two different B-Myb-specific siRNAs. Cells harvested 48 h after transfection were analyzed by western blotting with antibodies against B-Myb and β-actin. (B). HepG2 cells transfected with control or B-myb siRNAs were labeled for 5 min with EdU to visualize S-phase cells. Additionally, cells were stained with antibodies against histone H3 to visualize the total number of nuclei. (C). Quantification of EdU-positive cells. The bars show the percentage of EdU-positive cells in the total cell population, determined by counting 1,000 cells from different photographic fields and several independent knockdown experiments. Thin lines show standard deviations. The asterisks indicate statistical significance (** p < 0.01, Student’s-t-test).
