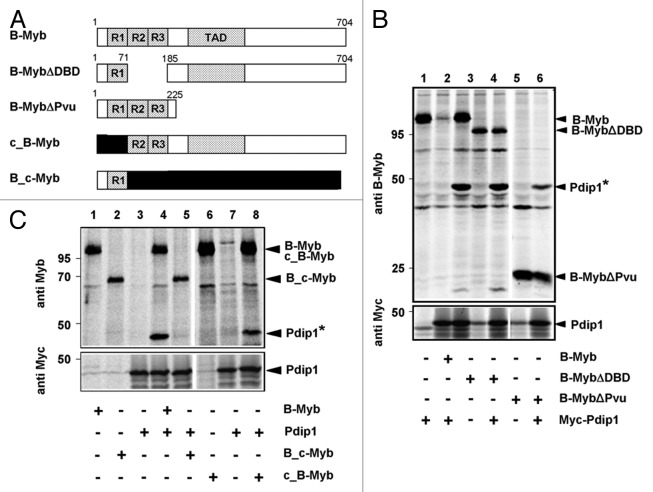
Figure 7. Mapping the binding region for Pdip1 within B-Myb. (A). Schematic illustration of B-Myb constructs. R1, R2, R3 and TAD refer to the repeats of the Myb DNA-binding domain and the transactivation domain, respectively. Small numbers refer to amino acids. c-Myb sequences are represented by black bars. (B and C). QT6 cells were transfected with expression vectors for Myc-Pdip1 and the indicated B-Myb constructs. Cells were radiolabeled with 35S-methionine and analyzed by immunoprecipitation with antibodies against B-Myb (top panels) or the Myc-tag (bottom panels), as described for Figure 5. In lanes 6 to 8 of (C), antiserum against c-Myb instead of B-Myb was used. Protein bands corresponding to Pdip1 and the B-Myb constructs are marked. Pdip1 co-precipitated via B-Myb is marked with an asterisk.

An official website of the United States government
Here's how you know
Official websites use .gov
A
.gov website belongs to an official
government organization in the United States.
Secure .gov websites use HTTPS
A lock (
) or https:// means you've safely
connected to the .gov website. Share sensitive
information only on official, secure websites.
