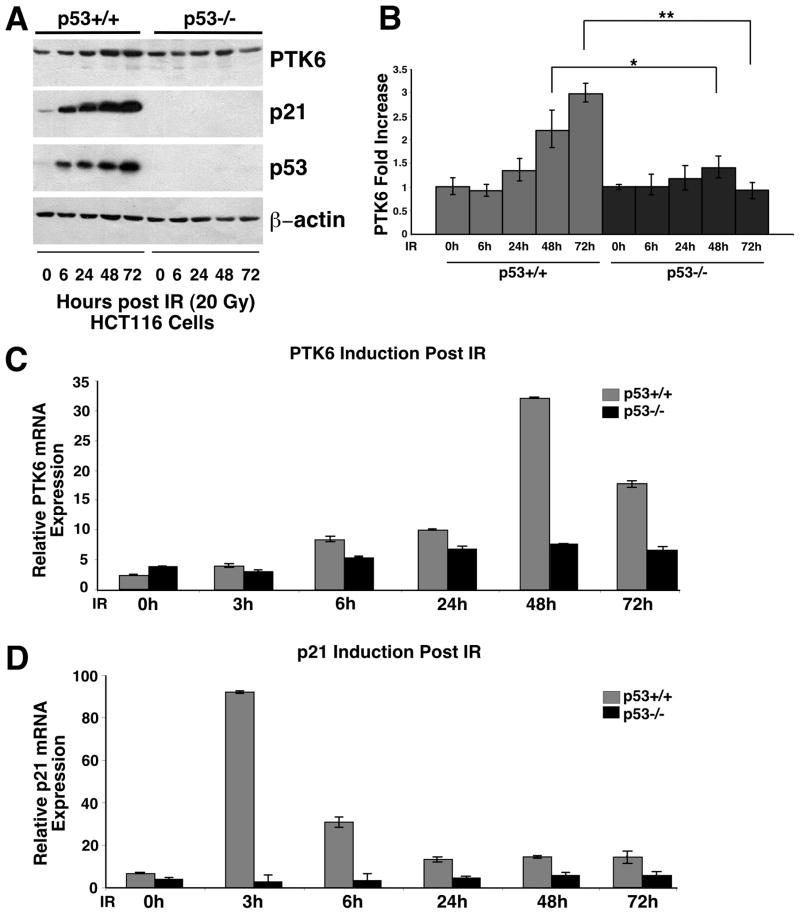
Figure 1. PTK6 expression increases following γ-irradiation in HCT116 cells.
(A) HCT116 p53+/+ and p53−/− cells were exposed to 20 Gy of γ-irradiation and harvested after 0,, 6, 24, 48 and 72 hours. Immunoblotting was performed using antibodies against PTK6, p21 and p53. β-actin was examined as a loading control. (B) The ratio of PTK6 toβ-actin was quantified using NIH ImageJ to determine the fold increase of PTK6 (* P< 0.05; ** P< 0.01, Bars +/− SD). (C) Quantitative real-time PCR analysis of PTK6 and p21 transcripts were normalized to levels of 18S rRNA, which was used an internal control (Bars +/− SD).

