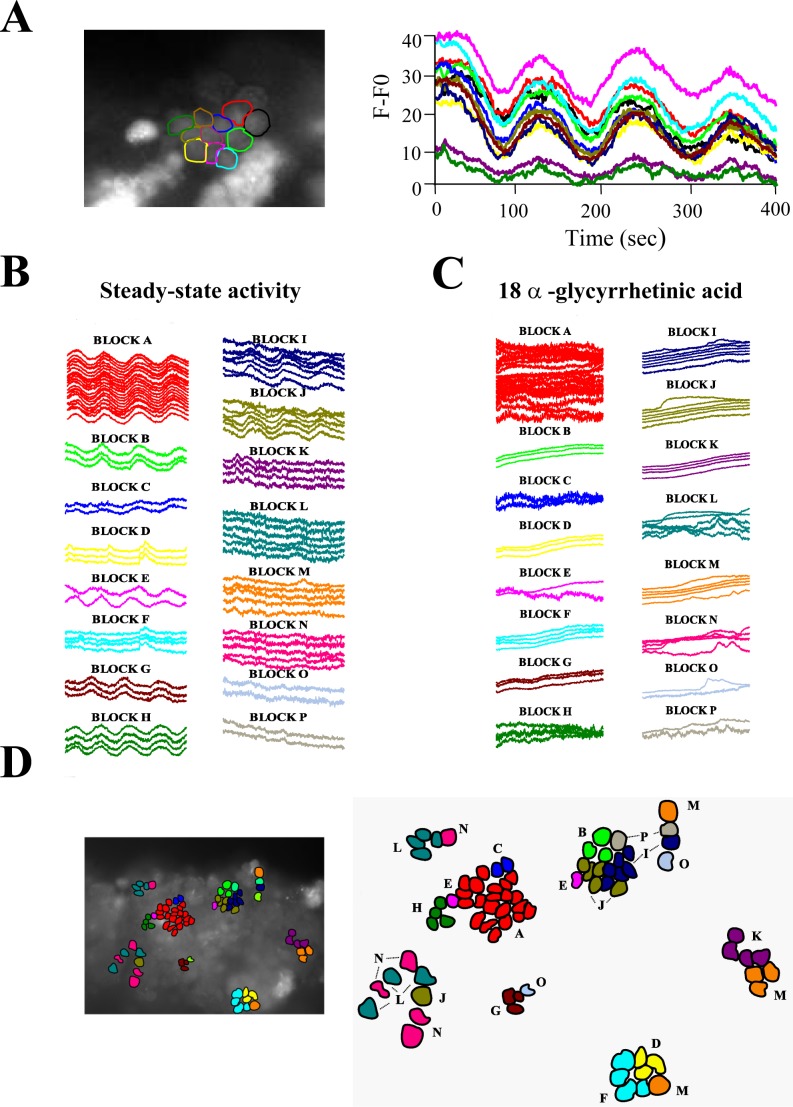
FIG. 6.
Clustered germ cells in SST preparations display spontaneous coupled Ca2+ oscillations. A) Left, fluorescence image obtained from a cluster of germ cells displaying spontaneous, synchronized Ca2+ oscillations (see Supplemental Movie S3; the movie was reduced to show one frame every 10 sec and was accelerated to 10 frames per second). Right, color traces correspond to the individual Ca2+ recording of each cell indicated with a colored outline. B) Single Ca2+ time series of SST cells experiencing steady-state Ca2+ fluctuations classified according to the groups of correlation identified by PCA (see Materials and Methods and Supplemental Fig. S2). Each trace corresponds to the normalized fluorescence of an SST cell during 10 min. C) Selected regions occupied by cells displaying synchronous steady-state Ca2+ changes on an SST preparation. The inset shows a fluo-4 AM fluorescence image of an SST with the regions occupied by the selected cells. The color code is the same as in A and indicates the groups of correlation identified. D) Single Ca2+ time series of SST cells after treatment with AGA, organized and colored according to the groups of correlation identified in B showing alterations and/or uncoupling of Ca2+ oscillations.

