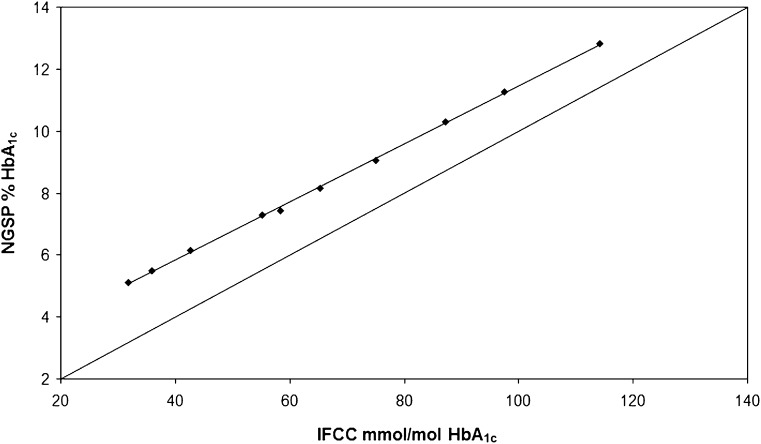
Figure 1.
Comparison of HbA1c values between the NGSP and IFCC networks. HbA1c was measured in 10 pooled blood samples by the NGSP (mean value of 7 network laboratories) and IFCC (mean value of 13 network laboratories) networks. ◆ is the regression line, and the solid black line is the y = x line (line of identity).

