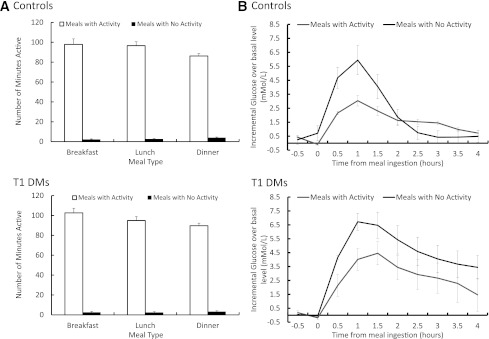
Figure 1.
A: Average PA in minutes after meals with activity and meals without activity for control and type 1 diabetic participants. B: Incremental CGM over basal levels in mmol/L with and without PA, for healthy control and type 1 diabetic participants. Data are represented in mean ± SE (n = 24). T1 DMs, type 1 diabetic participants.

