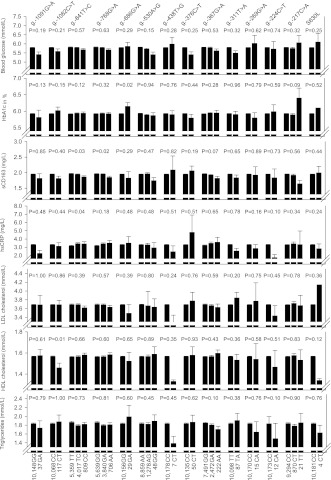
Figure 2.
Measures of glucose metabolism, inflammatory markers, and levels of lipids and lipoproteins as a function of 14 ABCG1 variants. Values shown are means ± SEM. P values by Kruskal-Wallis one-way ANOVA or Mann-Whitney U test. Parametric ANOVA and Student t tests gave similar results. All calculations were performed for 10,185 individuals in CCHS except for HbA1c, soluble CD163 (sCD163), and hsCRP, for which measurements were available for 5,661, 8,191, and 9,752 individuals, respectively.

