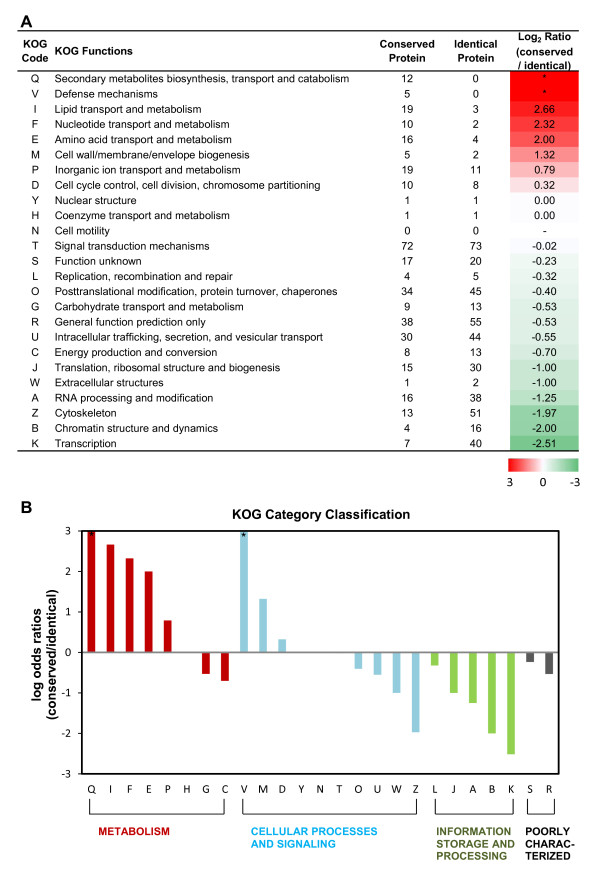
Figure 6.
Classification of the planarian conserved/identical proteins using KOG annotation. (A) The definitions of conserved protein and identical protein were derived from the identical match ratio calculation using the BLOSUM62 substitution matrix and the conserved region between homologous proteins in the 2 planarian species which were predicted by protein BLAST. After conserved domain search using the KOG database, each gene was classified in accordance with KOG functions. The columns of Conserved and Identical proteins show the numbers of genes that were classified into each function. The heat plot shows the log2 conserved/identical match ratio, with red indicating a high proportion of proteins with substitutions and green indicating that the majority of proteins are identical for the indicated function. * indicates a function that contained only conserved proteins (shown in red color). (B) KOG category classification shows obvious patterns that were clearly distinguishable for each category. Many relatively conserved genes were concentrated in ‘Metabolism’, whereas ‘Information Storage and Processing’ contained many identical genes.

