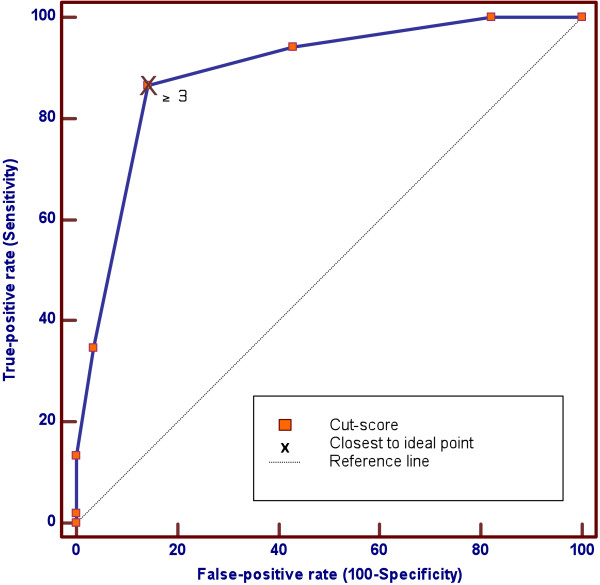
Figure 2.
ROC curve for SAPAS-AV as a screen for any personality disorder in the overall sample. Note. The ROC curve is significantly different (p < 0.0001) from the diagonal reference line, with an AUC of 0.89 (SE = 0.04). A cut-score of 3 or more on the SAPAS-AV is closest to the Ideal Test Point, with a sensitivity of 0.87 and specificity of 0.86.

