Figure 6.
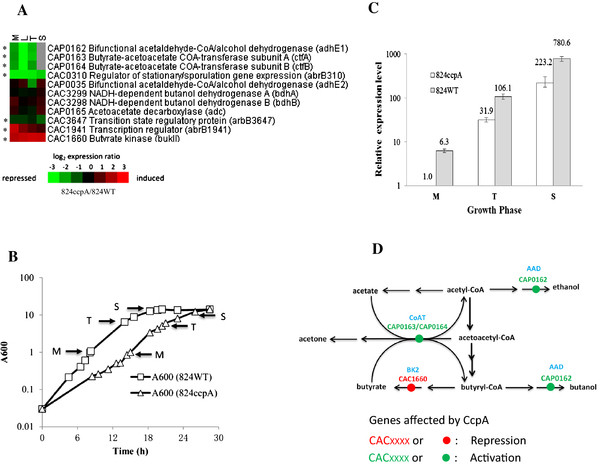
Role of CcpA in acidogenesis and solventogenesis. (A) Transcriptional profile of genes involved in acidogenesis and solventogenesis after ccpA inactivation. Red and green color represented the genes exhibiting increased and decreased expression level after ccpA inactivation, respectively. The genes showed obvious transcriptional changes (change-fold ≥ 2.0) were indicated in asterisks besides the heatmap. The data of sol operon (adhE1-ctfA-ctfB) at S time point was not included here because its expressional level exceeded the upper limit of microarray’s detection range. (B) Growth curve for qRT-PCR validation. (C) qRT-PCR validation for the expressional change of sol operon after ccpA inactivation. Cells were cultured in P2 medium containing 40 g/L d-glucose and 20 g/L d-xylose as the carbon sources. pH was controlled over 5.0 during the whole fermentation period by using aqueous ammonia. Cells were harvested at middle exponential phase M (A600 ≈ 1.0), transition phase T (A600 ≈ 8.0) and stationary phase S (A600 ≈ 12.0). The sol expression level of the 824ccpA strain at phase M was used as the control for normalization. M, middle exponential growth phase; T, acidogenesis-solventogenesis transition phase; S, stationary solventogenesis phase. The reported data were mean ± standard deviation (SD) of three technical replicates. (D) Schematic of the genes, for acids synthetic, acids re-assimilation and solvents formation, regulated by CcpA.

