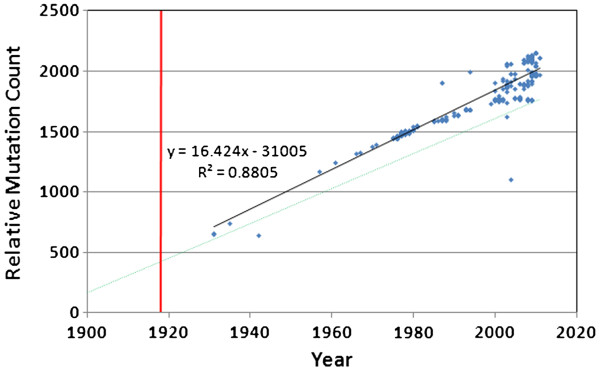
Figure 4.

Mutation accumulation in porcine H1N1. Solid line = porcine regression. Dashed line = the human regression line from Figure 3. There is considerably more variability among the porcine versions of H1N1, and there was a significant difference in the two slopes (ANCOVA, p=0.0001).
