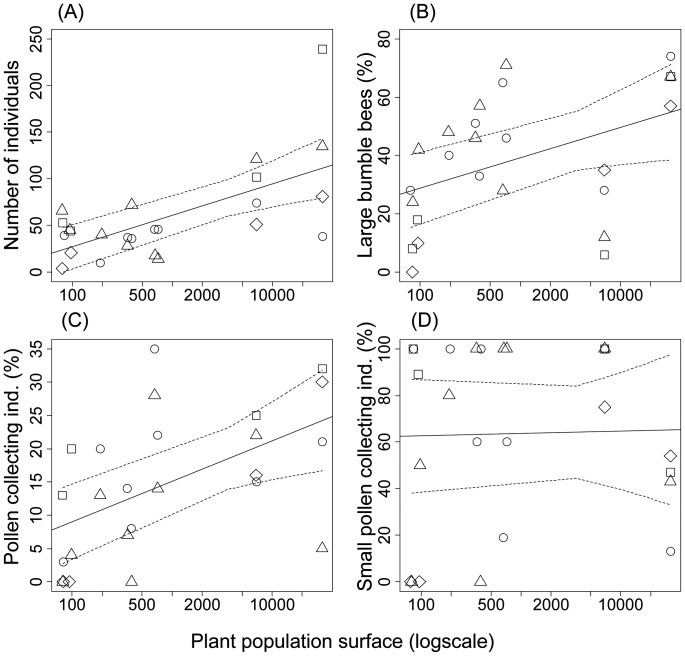
Figure 2. Different bumble bee variables plotted against plant population size.
Number of bumble bee individuals (A), proportion of large bumble bee species (B), proportion of bumble bees collecting pollen (C) and proportion of small bumble bee species collecting pollen (D). Data points are jittered on × axis with 2008: diamond, 2009: square, May 2010: circle, June 2010: triangle. Solid and dashed lines: regression line with 95% CI-bands.

