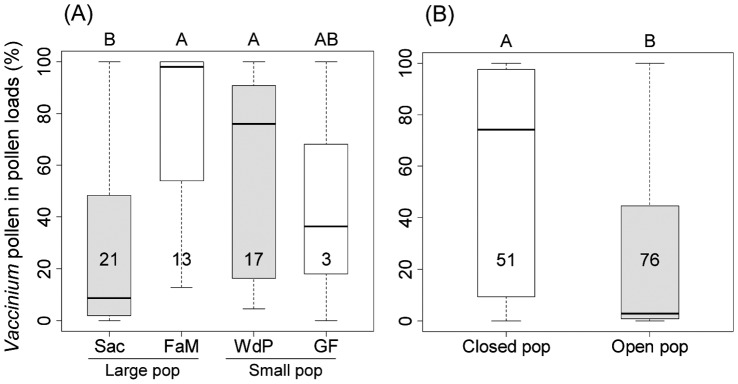
Figure 3. Vaccinium pollen (%) in corbicular pollen loads collected at different study sites.
Data for B. pratorum (A) and all Bombus species (B) pooled. The sites are arranged from large populations (Sacrawé = Sac, Fange aux Mochettes = FaM) to small (Wé de Pourceaux = WdP, Grande Fange = GF); open, patchy populations are marked with grey boxes. Different letters indicate significant differences (P<0.05) according to Mann-Whitney-U tests (A) or GLMM (B). Figures in boxes stand for sample sizes. Standard box plots with lines = median, boxes = 25% and 75%, whiskers = minimum and maximum without outliers.

