Figure 2.

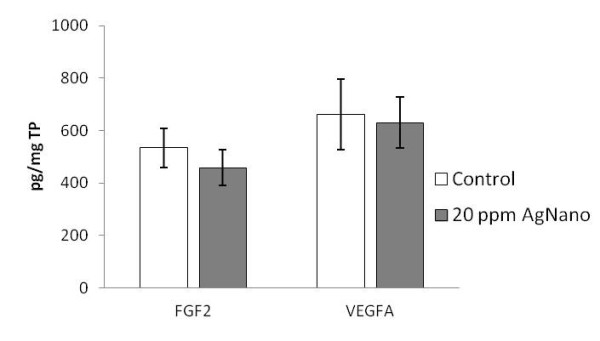
Protein expression in the breast muscle. The vertical axis shows the concentration of the target protein in picograms per milligram of total protein (TP). Error bars indicate standard deviation (SD). The level of significance is P < 0.05.

Protein expression in the breast muscle. The vertical axis shows the concentration of the target protein in picograms per milligram of total protein (TP). Error bars indicate standard deviation (SD). The level of significance is P < 0.05.