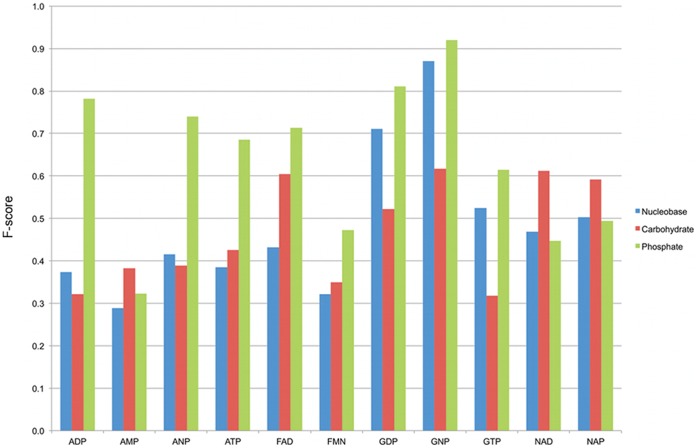
Figure 1. F-scores measuring the method performance for the different nucleotides.
Complete results reporting the F-scores for all the nucleotide types and for each nucleotide module considered. The bars are colored depending on the nucleotide module: blue for the nucleobase, red for the carbohydrate and green for the phosphate.

