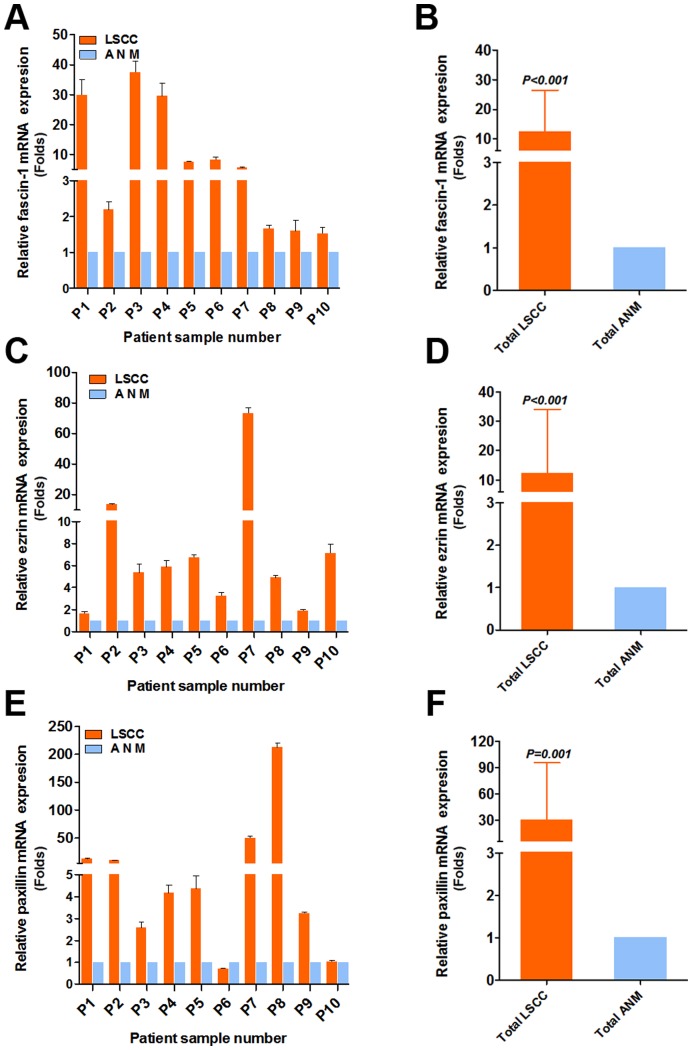
Figure 1. Quantitative RT-PCR analysis of relative mRNA level of fascin-1 (A), ezrin (C) and paxillin (E) in laryngeal squamous cell carcinomas (LSCC) and adjacent normal margin (ANM) tissue by sample pairs.
Levels were relative to that of 18s RNA as an internal control. Data are mean±SD from experiments performed in triplicate.

