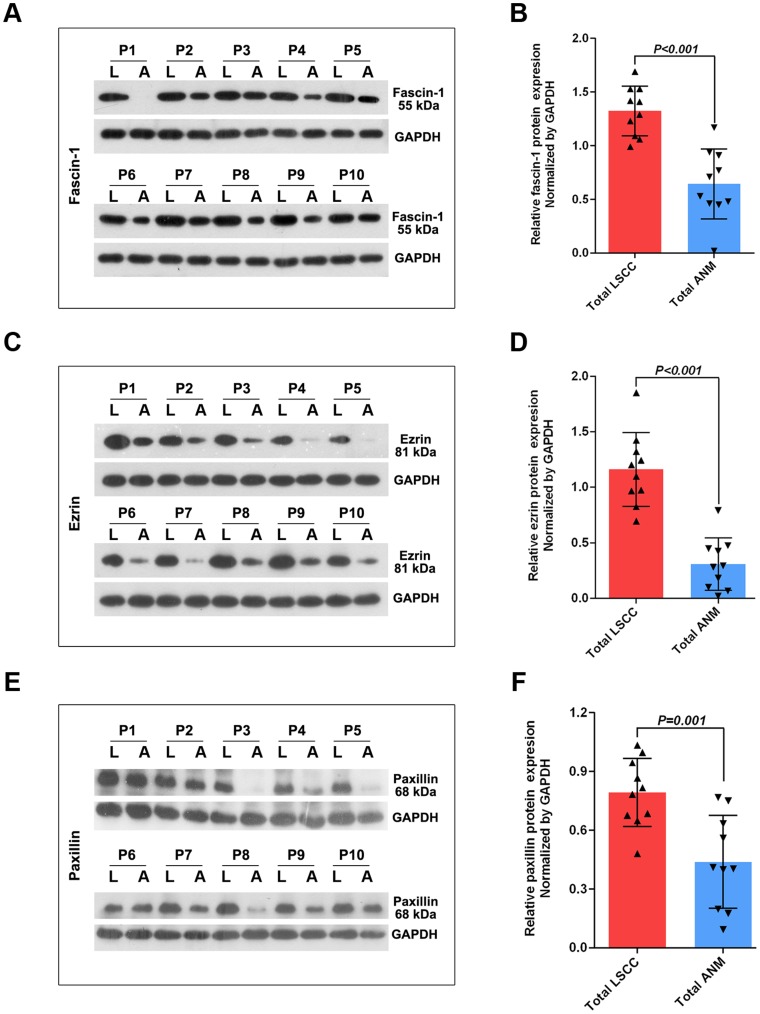
Figure 2. Western blot analysis and quantification of protein levels of fascin-1 (A), ezrin (C) and paxillin (E) in LSCC (L) and ANM (A) tissues (P1-P10).
Data are normalized by the loading control GAPDH. Bars are mean±SD fold increase or decrease from experiments performed in triplicate. Arrowheads represent data for each subject.

