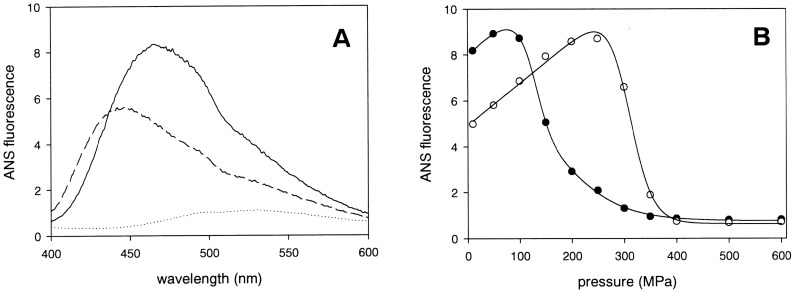
Figure 3. Protein fluorescence characterization in the presence of ANS.
Panel A: ANS fluorescence emission spectra of dimer (full line) and monomer (dashed line) bOBP in the absence of substrate at 0.1 MPa. In the absence of proteins, the ANS probe exhibits only low fluorescence (dotted line). Panel B: ANS fluorescence intensity at 450 nm of the dimer OBP protein as a function of pressure in the absence (filled symbols) or in the presence (empty symbols) of 1 mM 1-octen-3-ol, respectively.

