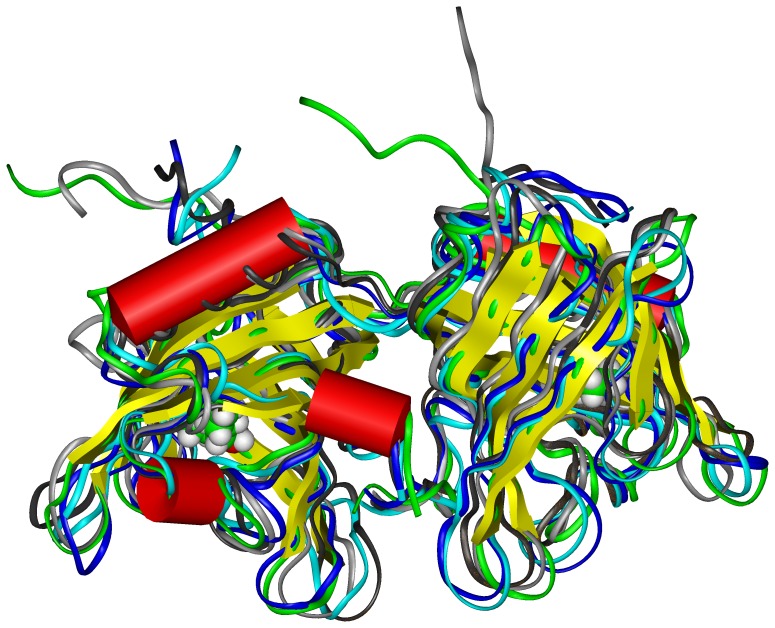
Figure 6. Super-impositions of the representative structures for each cluster in the different simulations.
At 0.1 MPa (cluster 1: dark grey, cluster 2 : light grey), 250 MPa (cluster 1: blue, cluster 2: cyan) and 600 MPa (orange) to the crystallographic structure of bOBP (green). Backbone is represented as a ribbon, secondary structures are represented as cylinders (helices) or flat ribbon (β-strands). The ligand 1-octen-3-ol is shown in CPK mode and color coded: carbon green, oxygen red, hydrogen white.

