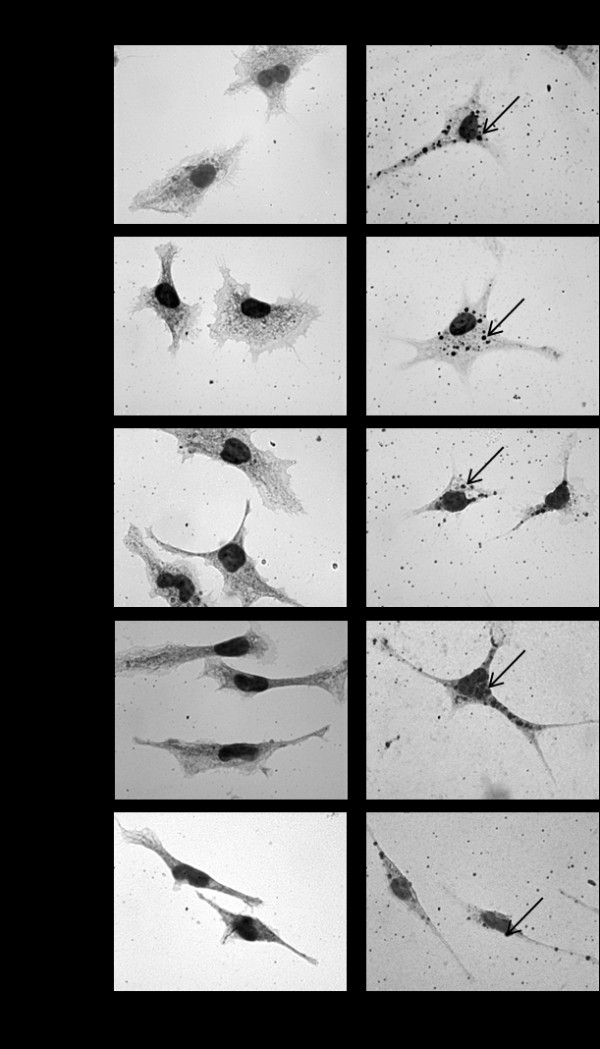
Figure 1.

Macrophage and foam cell morphology changes with topographical surface. Macrophages and foam cells were grown on flat, 10-, 50-, 100-, and 200-nm nanodot arrays for 3 days, stained with Oil Red O, and counter stained by hematoxylin (the arrows in foam cells indicate engulfed lipoproteins). Morphology was imaged by optical microscopy. Scale bar = 50 μm.
