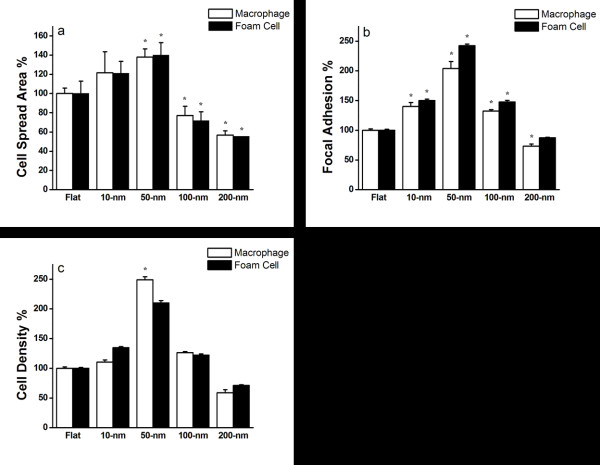
Figure 4.
Immunostaining showing distribution of vinculin (green) and actin filaments (red) in macrophages and foam cells. Macrophages and foam cells were seeded on flat, 10-, 50-, 100-, and 200-nm nanodot arrays for 3 days, and their morphology was observed by confocal microscopy. Scale bar = 25 μm.

