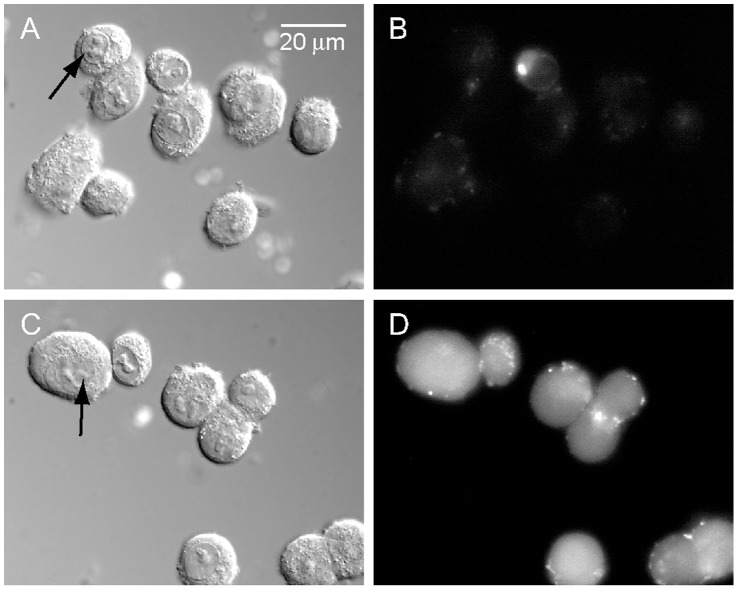
Figure 2. Cell images following LEF induced uptake of dextran-FITC.
COS-7 cells were exposed to LEF in the anode compartment for 60 s in the presence of dextran-FITC (38 kD). The cells were washed as described in section 2.5 and mounted on glass slide in PBS containing 0.01% TB. Images of cells were acquired by SCLM in the DIC (images A and C. arrows point to the cell nucleus) and fluorescence (485/530 nm, images B and D) modes. Images A and B depict cells exposed to LEF at ∼4°C. Images C and D depict cells exposed to LEF at room temperature.

