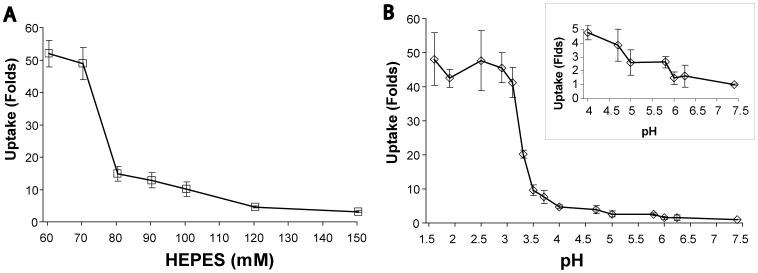
Figure 4. Dextran-FITC uptake as function of solution’s buffer capacity or solution’s pH.
Uptake of 71 kD dextran-FITC by COS-7 cells was analyzed by FACS. Results are given as folds of fluorescence geometrical mean ± SD of induced uptake relative to constitutive uptake. (A) Cells were exposed to LEF in the anode compartment for 60 s at different concentrations of HEPES buffered solutions. There is a statistically significant difference between all adjacent points (P<0.05 by t-test), except between the 60 mM and the 70 mM (P>0.05 by t test). (B) Cells exposed for 60 s to solutions tittered to different pH, in the presence of 71 kD dextran-FITC. The insert depicts a better detailed view in the pH range between 7.4 and 4.0. A statistically significant difference from the constitutive cell uptake begins at pH 5.8 (2.6 fold, P<0.01 by t-test, n = 9) down to pH 1.6. Cells’ uptake did not change significantly between pH 3.0 and pH 1.6 (P>0.05, one way ANOVA, n = 9).

