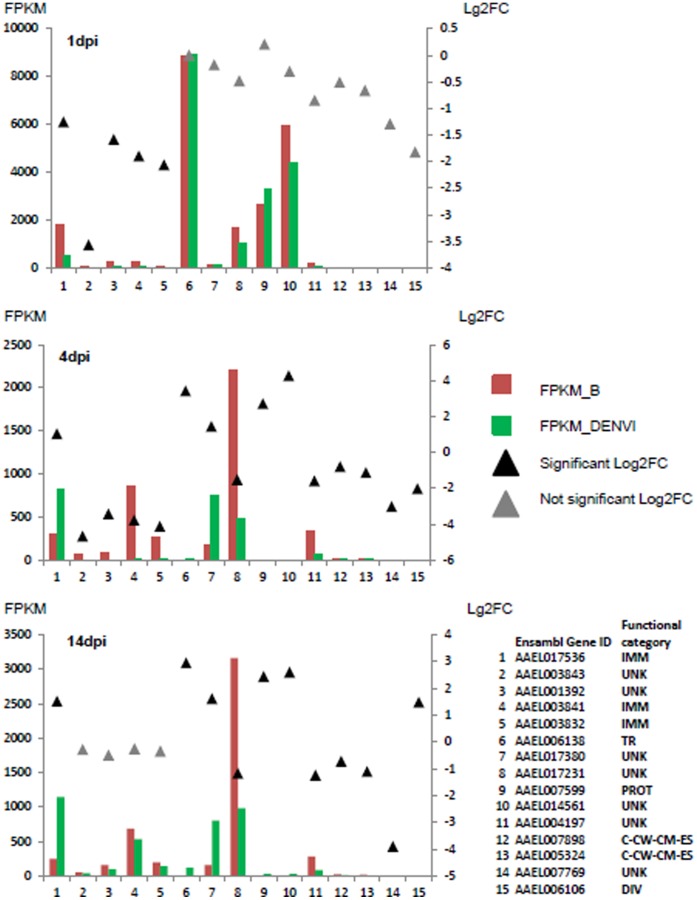
Figure 3. Genes whose transcripts accumulate differentially in carcasses throughout the course of dengue infection.
FPKM values (colored bars) and Log2-fold changes in accumulation levels (filled triangles) are plotted on the left and right y-axes, respectively. Individual genes are listed by Ensembl Gene ID numbers and represented by the numerals on the x-axis. Abbreviations for the functional categories of each gene are the same as Figure 2.

