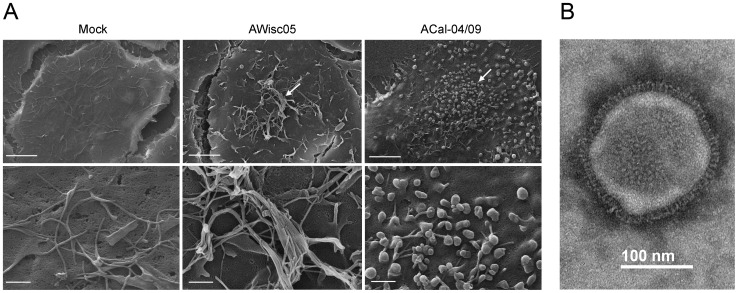
Figure 2. Electron microscopy analysis of TR or pH1N1-infected A549 cells.
(A) Mock infected A549 cells, and A549 cells infected with AWisc05 or ACal-04/09 were fixed at 18 h and processed for scanning electron microscopy. Bars measure 10 µm (top) and 1 µm (bottom). Arrows point to virions budding from infected cell surfaces. (B) Electron micrograph of negatively stained ACal-04/09 virion released from infected A549 cells.

