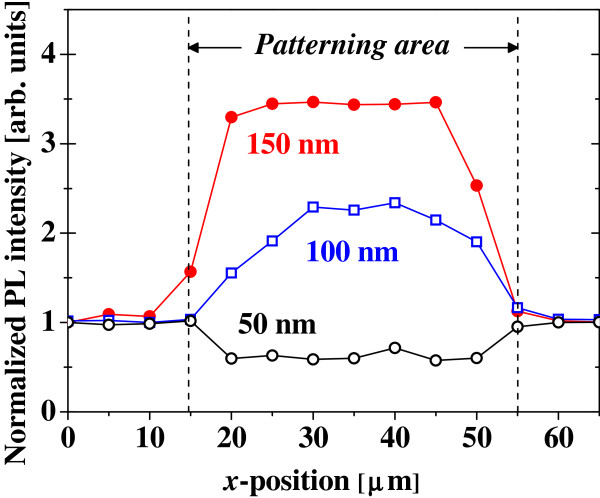
Figure 4.
PL intensities from the Si ND arrays. The PL intensities with a wavelength of 625 to 675 nm in the Si ND arrays with various sizes of the Au nanoplate (a solid red circle, 150 nm; an open blue square, 100 nm; an open black circle, 50 nm) are plotted as a function of the lateral measurement position of the micro-PL. The PL intensity is normalized for that from the Si ND array at the position of x = 0 μm where the Au nanostructure is not formed. The patterning area of the Au nanostructure is indicated by broken lines (x = 15 to approximately 55 μm).

