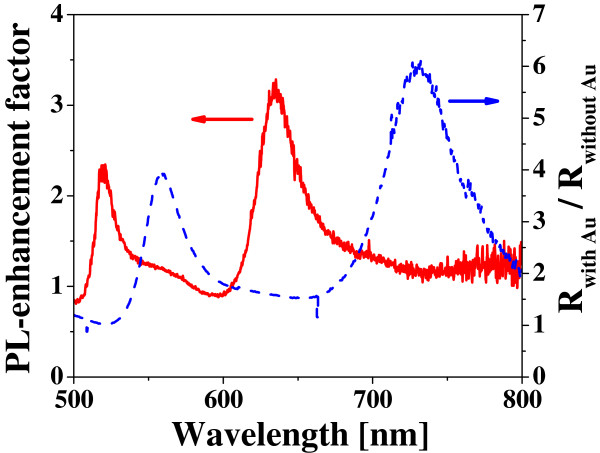
Figure 6.
An enhancement factor of the PL intensity. The enhancement factor is plotted as a function of wavelength in the hybrid nanostructure of Si NDs with 150-nm square Au nanoplates (a solid red line), where the PL intensity of the Si NDs with the Au nanoplates is divided by that without the Au ones. The reflectivity change originating from the existence of Au nanoplates is also plotted as a function of wavelength (a broken blue line), where the reflectivity for the sample surface with the Au nanoplates is divided by that without the Au ones.

