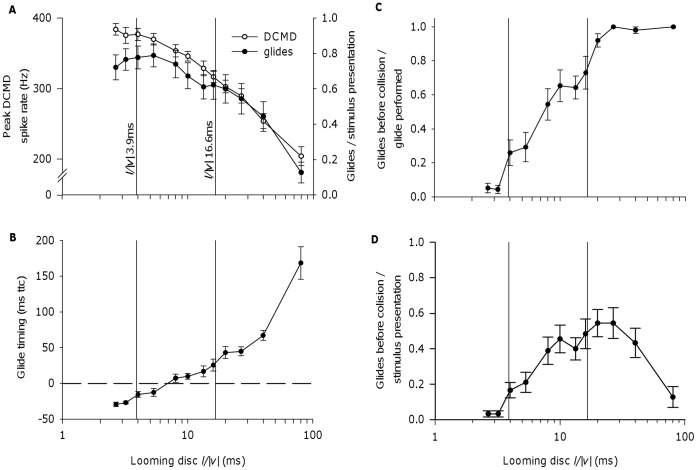
Figure 2. Estimated l/|v| for kite thoraces, and DCMD and behavioural responses to looming discs of varying l/|v| in Locusta migratoria.
A, Known trends in DCMD and behavioural response properties over the range of l/|v| values estimated for the thoraces of looming kites (vertical lines in this and subsequent panels, see text). Both DCMD peak spike rate (open circles; as previously demonstrated for Schistocerca spp. [29], [30]) and gliding response occurrence (closed circles, as previously demonstrated for L. migratoria [37]), increased with decreasing l/|v| in our experiments on L. migratoria. Both DCMD and gliding responses were strong within the kite-like range of l/|v| values. B, In our experiments, the mean timing of glide initiation, relative to the predicted time of collision, declined with declining stimulus l/|v|, and mean glide timing was after the moment of collision (dashed line) for the looming discs with the lowest l/|v| ratios tested. C, Glides could still be successfully initiated before collision within the estimated range of kite-like l/|v| values. Plot shows the number of glides successfully initiated before the moment of collision as a proportion of all glides performed. D, The number of glides initiated before collision expressed as a proportion of stimulus presentations. Plot shows the combined effect of increasing glide occurrence with decreasing l/|v| (panel A, black circles), and increasing probability of glide initiation before collision with increasing l/|v| (panel C). DCMD response measurement in panel A: N = 10 locusts (value for each individual a mean of responses to 6 presentations of each stimulus). Glide measurements in panels A and D: N = 15 locusts (value for each individual calculated from 6 presentations of each stimulus). Glide measurements in panels B and C: Varying numbers of individuals per data point since locusts that did not glide could not be included. N at l/|v| 80.0 ms = 5; l/|v| 40.0 ms = 13; l/|v| 26.7, 20.0, 13.3, 10.0, 8.0, 2.7 ms = 14; l/|v| 16.0, 5.3, 4.0, 3.2 ms = 15. In all panels, means plotted ± SEM.

