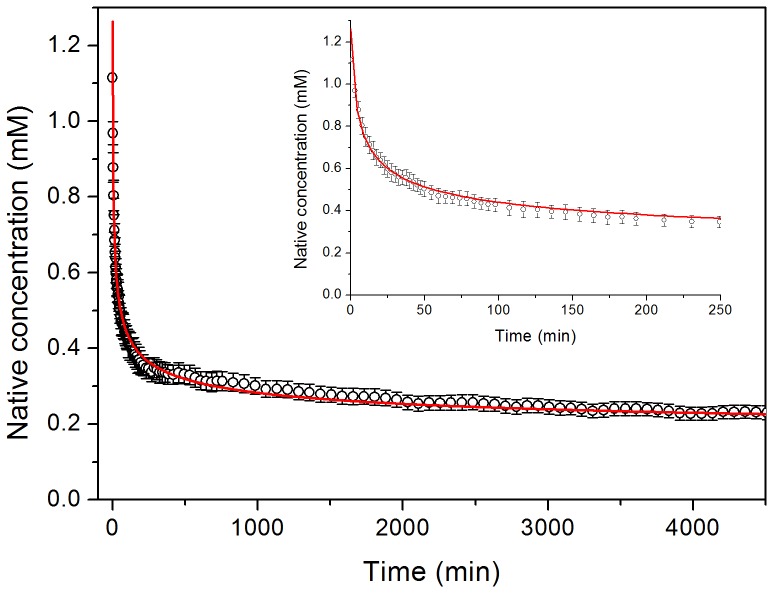
Figure 2. Kinetics of native-state depletion monitored by NMR.
Averaged and normalized intensities of the cross peaks of all residues of N7A Spc-SH3 in a series of 15N-1H-HSQC NMR spectra recorded during the course of aggregation at 37°C using an initial protein concentration of 1.1 mM. The red continuous line represents the best fit using the integrated equation of an n-order irreversible kinetics. The inset shows an expansion of the early times of the kinetics.

