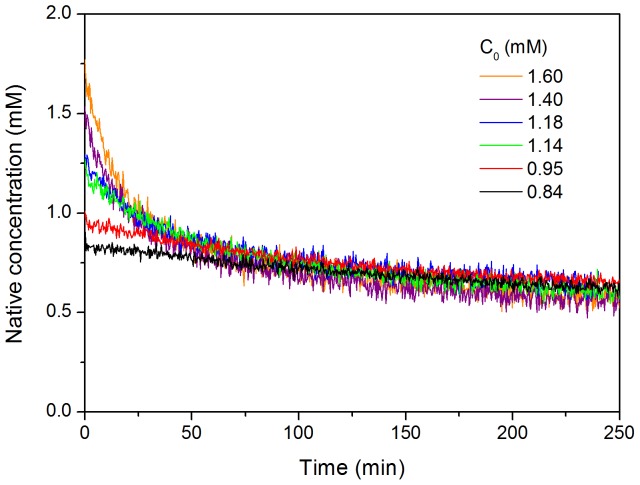
Figure 3. Kinetics of native state depletion monitored by near-UV CD.
Different initial protein concentrations of N47A Spc-SH3 were analyzed as indicated. The intensity of the native CD signal at 295 nm was monitored as a function of time and normalized using the values of initial protein concentration.

