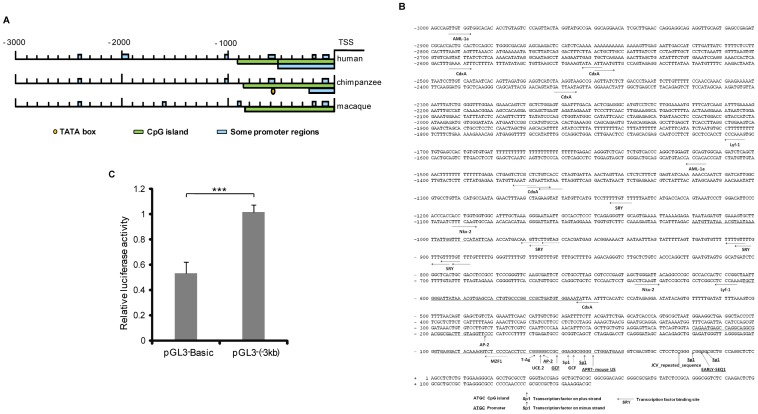
Figure 1. Bioinformatics analysis of the MGARP promoter.
A. Promoter analysis comparing the −3 kb upstream region of the MGARP gene between three species (Homo sapiens, Pan troglodytes and Macaca mulatta). B. A summarized display of the −3 kb upstream region in the human MGARP promoter with predicted promoter and transcription factor (TF) binding sites. C. Luciferase (Luc) reporters driven by the 3 Kb MGARP promoter (pGL3-(−3 kb)) and the promoter-less control (pGL3-Basic) were transfected into HEK-293T cells and analysis was carried out as described in Materials and Methods. *** represents p<0.001 and #represents p>0.05 (no significant difference).

