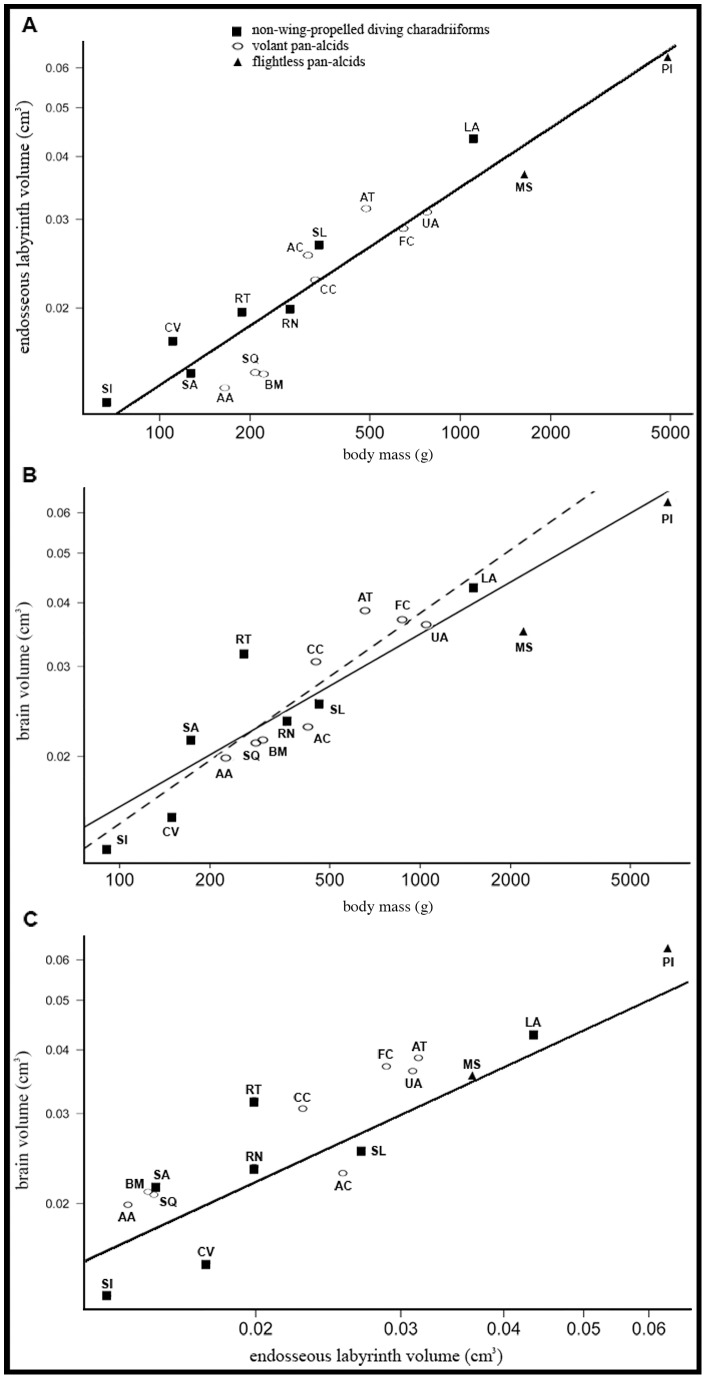
Figure 12. Scatterplots showing the relationship between endosseous labyrinth volume and body mass (A; r2 = 0.88), endocranial volume and body mass (B; r2 = 0.83, β = 0.510±0.058 s.e.), and between endocranial volume and endosseous labyrinth volume (C; r2 = 0.82).
All values (Table 3) were natural log transformed and are plotted on scales of raw values. The dashed regression line in B shows the change in slope that resulted when data for flightless species Pinguinus impennis and Mancallinae sp. were removed (re-calculated values: r2 = 0.88; β = 0.626±0.085 s.e.). Taxonomic abbreviations: Aethia cristatella (AC), Alca torda (AT), Alle alle (AA), Brachyramphus marmoratus (BM), Cepphus columba (CC), Charadrius vociferus (CV), Fratercula corniculata (FC), Larus argentatus (LA), Mancallinae sp. (MS), Pinguinus impennis (PI), Rissa tridactyla (RT), Rynchops niger (RN), Stercorarius longicaudus (SL), Sterna anaethetus (SA), Stiltia isabella (SI), Synthliboramphus antiquus (SQ), Uria aalge (UA).

