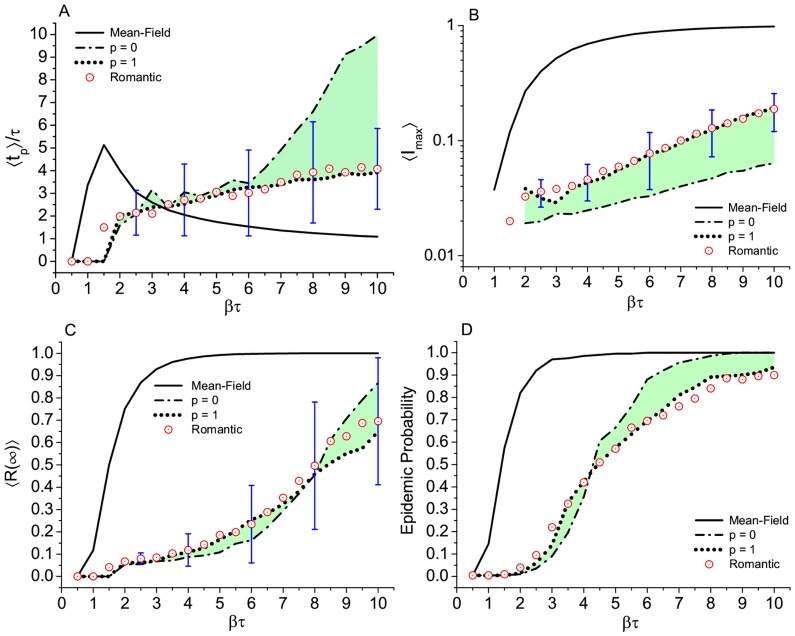
Figure 4. Epidemic simulation of the SIR model in different topologies.
Watts-Strogatz, Romantic, and fully connected networks. Results for (A) time to the epidemic peak, (B) maximum number of infected subjects, (C) total number of removed or final prevalence, and (D) epidemic probability, defined as the fraction of realizations that end up with more than 5% of the population affected. Each point of the curves is the result of an average of over 200 independent runs on 10 different graphs (except for the Romantic network which is only one graph). Error bars, only displayed at some selected points, correspond to the standard deviation over the 200 runs in the Romantic network case. Green shadows help to visualize the variation of the outcome due to the progressive disorder in the W-S networks.

