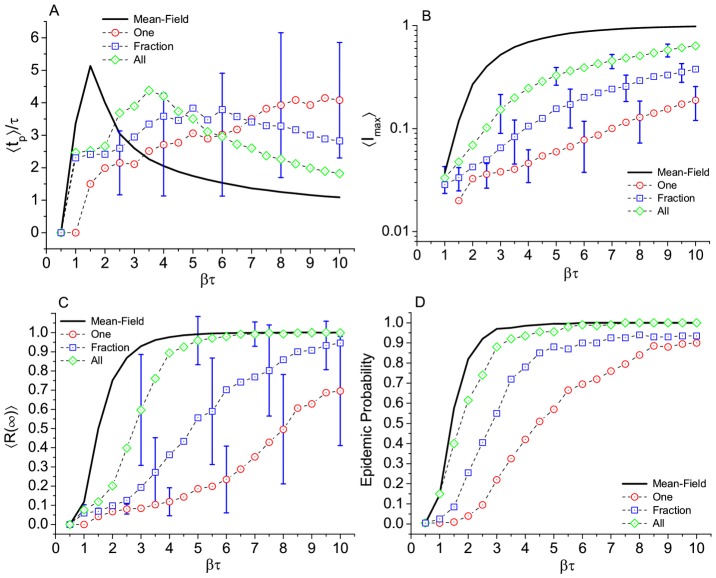
Figure 8. Effect of the different rules of interaction on.
Results for (A) time to the epidemic peak, (B) maximum number of infected subjects, (C) final prevalence, and (D) epidemic probability. Comparison with standard mean field results in the same network. Number of runs, average per point, and error bars as in Fig. 4.

