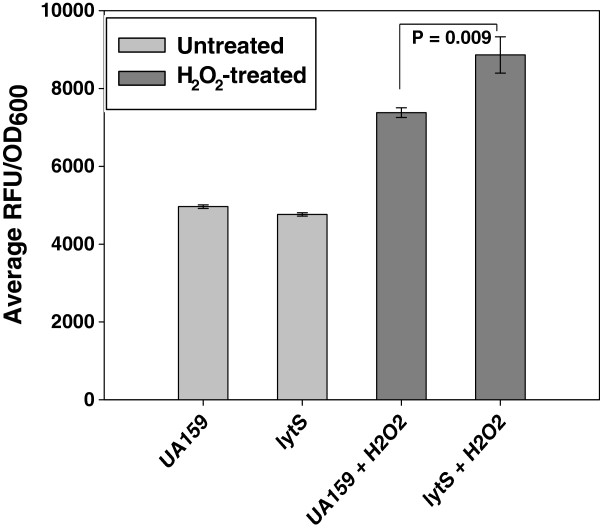
Figure 5.
Measurement of intracellular ROS in UA159 and lytS mutant by CM-H2DCFDA staining. Cells were harvested from 20 h BHI cultures of UA159 and isogenic lytS mutant grown at 37°C 5% CO2 (n = 3-6 biological replicates each), resuspended in HBSS containing 5 μM CM-H2DCFDA, and incubated at 37°C to load the cells with stain. After 60 min incubation, cell suspensions were centrifuged, washed once in HBSS buffer, and then resuspended in HBSS buffer alone (light grey bars) or in HBSS containing 5 mM H2O2 (dark grey bars). Each suspension was transferred to wells of an optically-clear 96 well plate, and incubated at 37°C in a microplate reader. Cell fluorescence (as measured by relative fluorescence units; RFU) and the OD600 of each well was recorded after 30 min incubation. RFU measurements are expressed per OD600 of each well to account for any subtle variations in cell density. Error bars represent SEM. Brackets with P values denote statistically-significant differences between two samples (Mann–Whitney Rank Sum Test).

