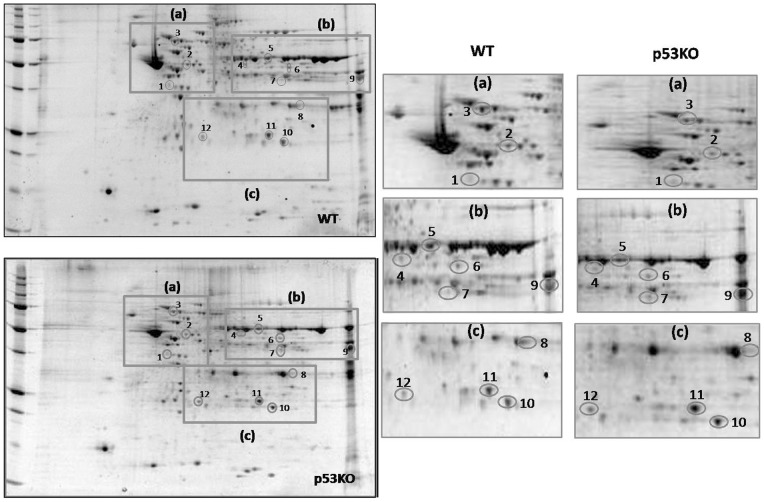
Figure 1. Proteomic analysis of differential protein expression (WT vs. p53KO).
Proteomic profile of representative 2D-gels with proteins differently expressed between mitochondrial fraction isolated from the brain of WT mice and p53(−/−) (left); expanded images of protein spots that have significantly different levels (p<0.05) between WT and p53(−/−) (right).

