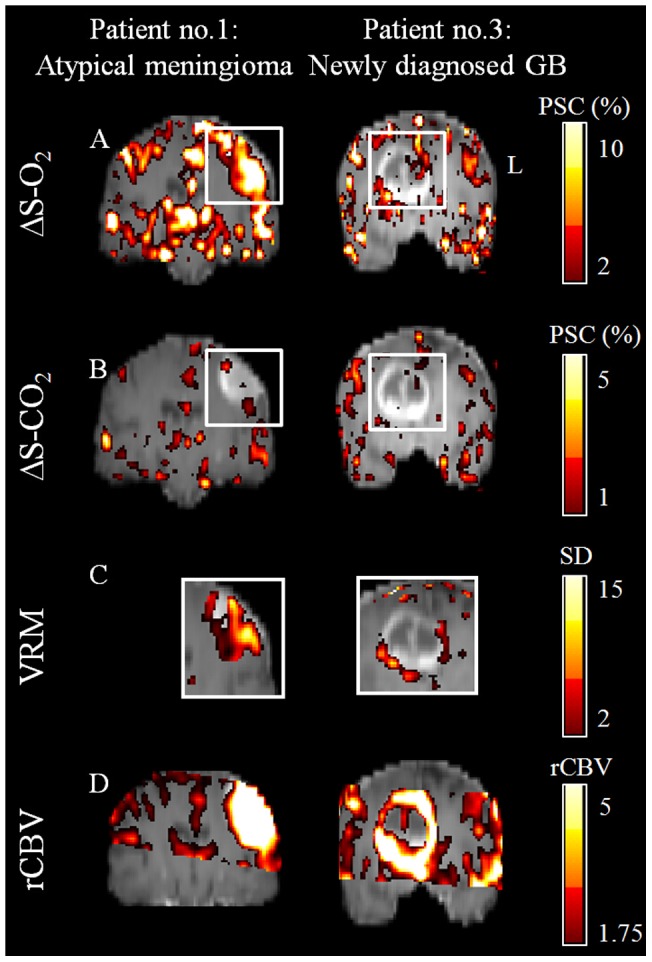
Figure 2. Hemodynamic Response Imaging in patients.

HRI results obtained from a patient with atypical meningioma (Left; patient number 1) and from a patient with newly diagnosed glioblastoma (Right; patient number 3); For both patients a representative coronal slice through the tumor center of (A) ΔS-O2 maps, (B) ΔS-CO2 maps, (C) VRM maps (of the tumors area which are marked by white rectangle on figures A and B) and (D) rCBV maps. All the maps are superimposed on the anatomical images. Color scales for all maps are located on the right side. PSC- percent signal change; SD- standard deviation.
