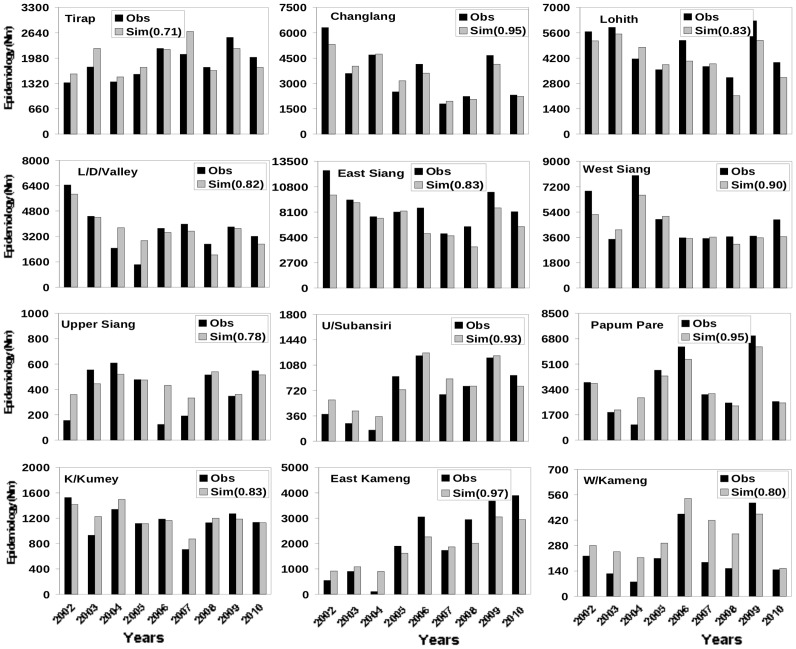
Figure 5. Inter annual variability in observed and simulated malaria epidemiology.
Inter annual variability in observed (NBSP) and simulated (NM) malaria epidemiology for the twelve districts calculated using daily temperature, surface humidity and 24 hour accumulated rainfall. The meteorological parameters (temperature, humidity and rainfall) for each district have been adopted for the corresponding year from NCEP daily reanalysis data. The number in the bracket represents the correlation coefficient between observed and simulated epidemiology for the respective district.

