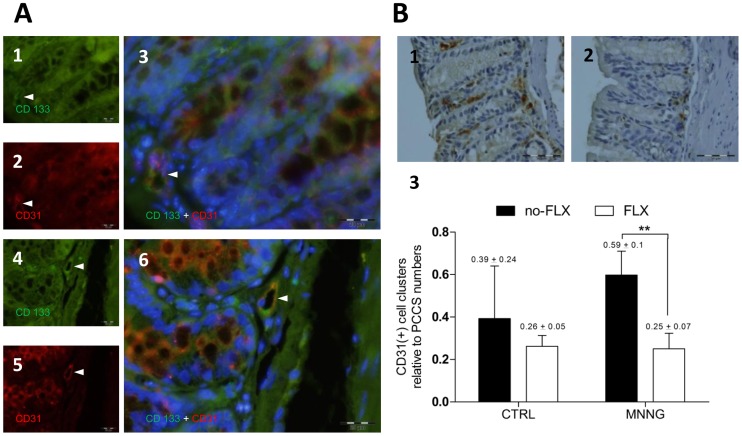
Figure 6. Fluoxetine activity and an angiogenic-related marker.
(A) Representative images of colon sections labeled with anti-CD133 and anti-CD31 antibodies, and nuclei stained with DAPI. White arrows indicate single-stained and double-stained positive cells into PCCS areas in colon sections from (A1 to A3) MNNG without FLX treatment, and (A4 to A6) MNNG+FLX treatment groups. (A3 and A6) Double-stained positive cells are shown by white arrows in microvessel-like structures nearby cryptal bottoms. Pictures were taken with FITC (495–521 nm), ultraviolet (358–461 nm), and Texas Red (595–605 nm) filters. All pictures were taken at 600x magnification, scale bars represent 20 µm. (B) Representative images of single colon-stained sections with anti-CD31 antibody (positive cells are seen with dark-brown cytoplasm) from (B1) MNNG without FLX treatment, and (B2) MNNG+FLX treatment groups. Pictures were taken at 400x magnification, scale bars represent 50 µm. (B3) Relative number of CD31 positive cell clusters detected per PCCS area (**p<0.01; MNNG without FLX, n = 4; FLX+MNNG, n = 4).

