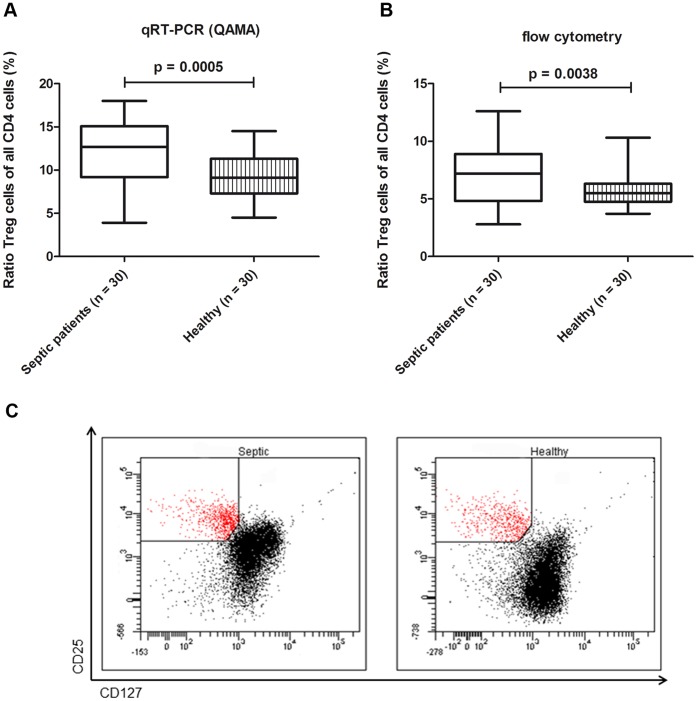
Figure 3. Quantification of Treg cells in septic patients and healthy individuals. A.
Relative quantification of Treg cells by FOXP3 Treg-specific demethylated region (TSDR) real-time quantitative polymerase chain reaction (quantitative analysis of methylated alleles, QAMA) B Relative quantification of Treg cells (characterized as CD4+ CD25hiCD127low) by flow cytometry C Representative quantification of one septic patient and healthy subject by flow cytometry. Setting of the CD25 and CD127 flow cytometer gates are shown.

