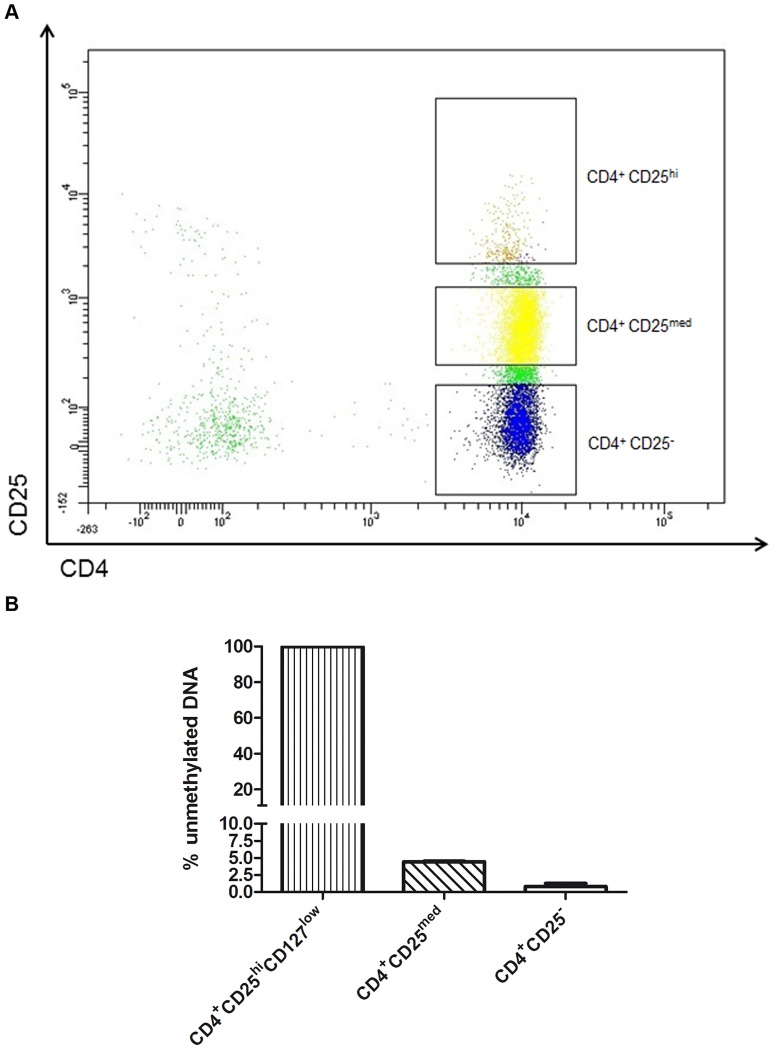
Figure 5. Illustration of the CD25 and CD4 gate settings used to sort various CD4+ populations.
CD4+ CD25med cells showed an unmethylated ratio of 4.4% (SD ±0.17%); CD4+ CD25− cells, of 0.8% (SD ±0.60%); and CD4+ CD25hiCD127low cells of 99.8% (SD ±0.24%)with FOXP3-TSDR QAMA. Results were calculated of four experiments from four healthy men.

