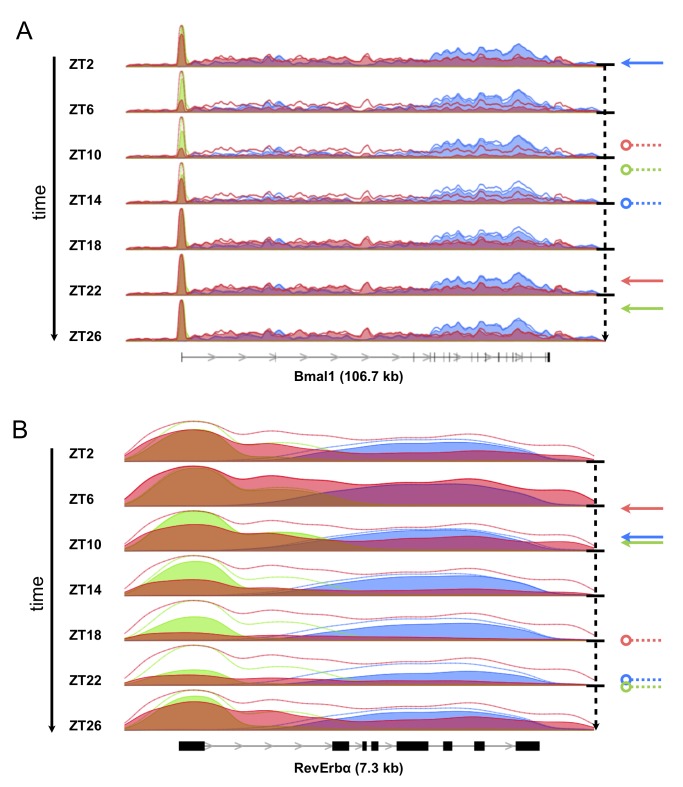
Figure 1. Pol II, H3K4me3, and H3K36me3 genomic profiles of core circadian clock genes measured around the clock.
(A) The density profiles of Pol II (red), H3K4me3 (green), and H3K36me3 (blue) are indicated for the Bmal1 gene, which spans 107 kb on chromosome 7, with the thin lines above the profiles indicating the position-specific temporal maxima. The gene structure (RefSeq transcripts) is shown below the panel. The dashed lines starting with a circle and the arrows represent minima and maxima, respectively, of gene body Pol II occupancy (red), promoter H3K4me3 occupancy (green), and gene body H3K36me3 occupancy (blue), as estimated by cosine fits (Materials and Methods). Maximal Pol II, H3K4me3, and H3K36me3 densities are reached at ZT21, ZT23, and ZT2. (B) As in (A), but for the RevErbα (Nr1d1) gene, which spans 7.3 kb on chromosome 11. Maximal Pol II, H3K4me3, and H3K36me3 densities are reached at ZT6, ZT9, and ZT9. Temporal animations of these profiles are provided as supplemental movies. Similar profiles for the circadian Per1 gene and constitutive Tbp gene are shown in Figure S1.

