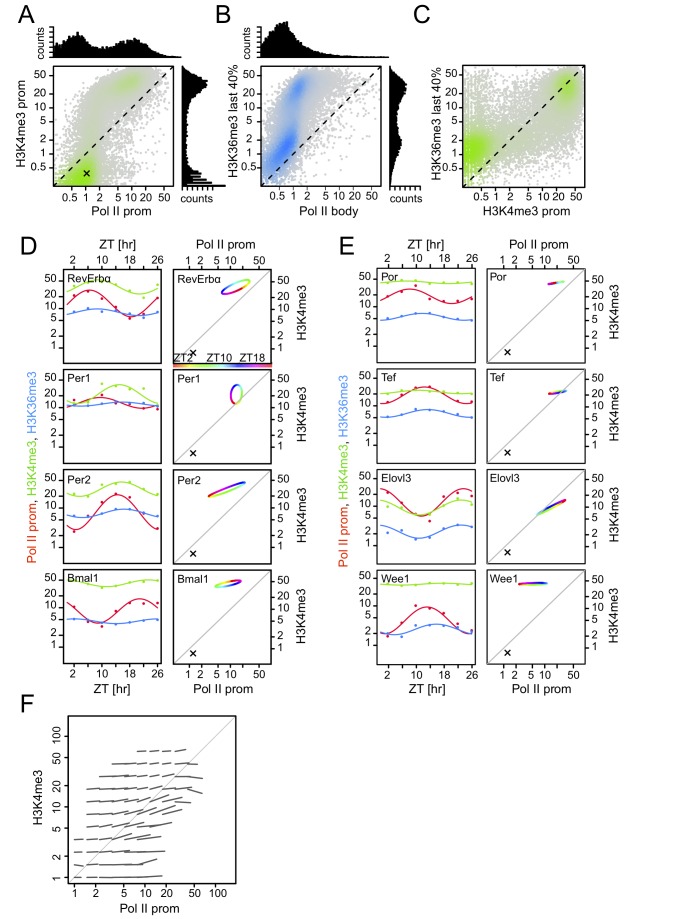
Figure 4. H3K4me3 and H3K36me3 marks vary during the diurnal cycle with reduced amplitude as compared to Pol II occupancy.
(A) H3K4me3 promoter levels versus Pol II promoter occupancy at ZT2. Two populations can be identified from the densities: silent (or weakly active) promoters (lower left cloud) and active promoters (fainter cloud shifted above the diagonal and to the right). Bimodality in both signals is clearly seen in the projections (histograms). The cross sign, also shown in panels D and E, indicates background levels estimated from the lower maxima of the histograms. (B) H3K36me3 levels (quantified over the most 3′-proximal 40% of gene bodies) versus Pol II body occupancy at ZT2. Two populations can be identified from the densities: silent (or weakly transcribed) genes (lower left cloud) and transcribed genes. (C) H3K36me3 levels as in (B) versus H3K4me3 promoter levels at ZT2. This comparison shows the two classes most clearly, indicating that the large majority of genes harboring H3K4me3 marks are transcribed. In (A–C), data are shown for ZT2, but all time points looked identical. (D–E) Temporal profiles of H3K4me3 and H3K36me3 marks, and promoter Pol II occupancy for some core clock genes (D) and selected output genes (E). Left, temporal profile for promoter Pol II occupancy (red), H3K4me3 marks (green), and H3K36me3 marks (blue) together with cosine fits. Right, the cosine fits for Pol II promoter occupancy and H3K4me3 plotted against each other in the coordinates of panel A. ZT times are color-coded (see color bar). Crosses indicate background levels. Note that levels of H3K4me3 remain relatively high at the troughs of transcription (as measured by Pol II density). (F) Genome-wide temporal analysis showing that H3K4me3 modifications at promoters show compressed amplitudes compared to Pol II promoter occupancy (compare with Figure 3E). Each line shows the average orientation and amplitude of changes during a diurnal cycle for genes in regions of a grid. The nonbinned plot is shown in Figure S5.

