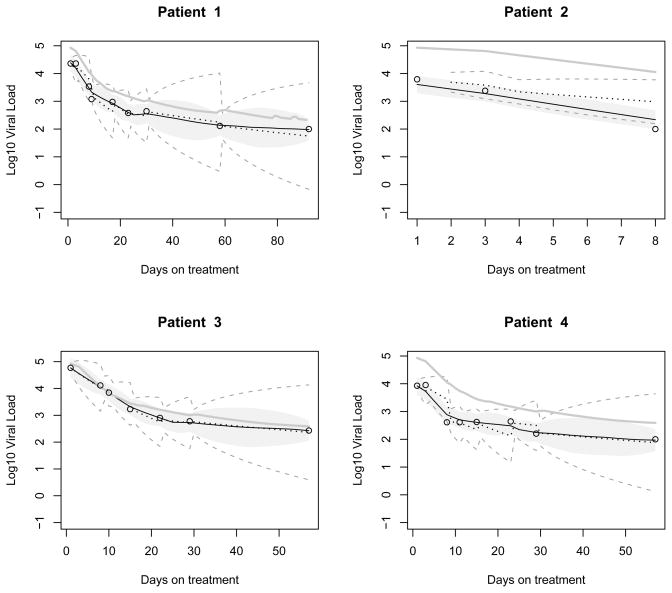
Figure 2.
Estimation and prediction of viral load for four patients in the HIV dynamic study (four subjects with different number of measurements and different response patterns are selected for illustration). Base 10 logarithm of the viral loads are shown in circles. The smoothing estimates using the Gibbs sampler approach are shown in black solid curves, and the 95% error bounds are shown by the shaded grey region. The one-step-ahead Kalman forecasts are shown in black dotted curves, and the prediction error bounds are in grey dashed curves. The estimates of population state variable are shown as the gray solid curve.

