Fig. 3.
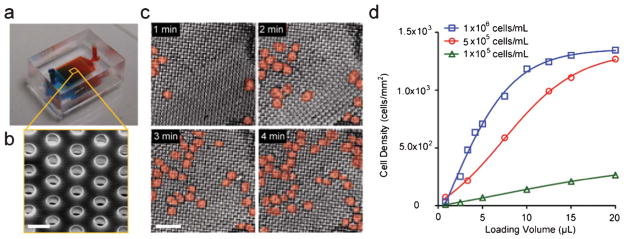
Isolation and enrichment of THP-1 cells using the MIPA device (a) A photograph of the MIPA device. The MIPA device was injected with dyed solutions for visualization of the cell culture chamber and the immunoassay chamber. The device dimension is 9 mm L × 7 mm W × 4 mm H. (b) SEM image showing the PMM. Scale bar, 10 μm. (c) Temporal sequence of false-colored brightfield images showing isolation and enrichment of THP-1 cells on the PMM. The cell loading concentration was 5 × 10⁵ cells mL−1 at 5 μL min−1 flow rate. Scale bar, 100 μm. (d) Plot of density of trapped cells on the PMM as a function of injection volume, using three different cell loading concentrations as indicated.

